Tag Archive for: Defence Spending

Policy, what policy?

Australian service personnel vote while on Operation Slipper in Afghanistan.An ear-piercing alarm should ring the moment a politician pretends national security is too important for party politicking. You know they’re lying. That’s because within seconds they’ll set about violating their own injunction. Thin, grasping, avaricious fingers reach out from beneath the purity of the policy wrapping. They’re clutching around for any scrap of partisan political advantage they can use to belabour their opponents.

Before the campaign began Kevin Rudd flew to Afghanistan to thank the troops. That was terrific and appropriate. Nor should Tony Abbott be prevented from demonstrating his own personal battle-fitness by doing push-ups with the troops. These are the sorts of anodyne images you expect during election campaigns.

Last week was different. For the first three weeks of the election campaign a deafening silence had enveloped strategic issues. But then, quite suddenly, the military was all anyone wanted to talk about. A deliberate, systematic attempt was being made to use national security for partisan political advantage. Read more

The Defence budget: a first look

Mark Thomson is squirreled away producing his usual tour de force budget analysis (on the streets May 30) so readers of The Strategist will have to make do with my first take on the Defence budget.

Let’s start with a look at the headline figures. A reasonable figure for how much money Defence will have is ‘Total Defence Funding’. Last year’s budget (as amended at Additional Estimates) provided Defence with $24.355 billion. This year’s figure is $25.434 billion—a nominal year-on-year increase of $1.079 billion, or 4.4%. But in real terms (allowing for inflation), the increase is a little over 2.1%, or about $519 million. It’s worth noting that the increase is against a pretty low baseline—as Mark pointed out, last year’s budget represented a greater than 10% real decrease on the previous year. Still, I suspect that Defence is relatively relieved by this outcome. At least for this year, the Lord giveth.

Table 1. Total Defence funding.

Table 1. Total Defence fundingSources: Defence Additional Estimates Feb 2013, Defence Portfolio Budget Statement May 2013.

One of my major interests is the capital acquisition budget; in crude terms, the money available to buy the ADF’s new equipment and the facilities and support required to operate them. Looking out across the forward estimates, there’s some extra cash there, amounting to more than $3.5 billion compared to last year. (See the table below.) But the budget papers say that the defence budget has been ‘re-profiled’ over the forward estimates. In other words, money has been taken from future years to allow investment to proceed in the near-term. In that sense, there’s actually no extra money for equipment in the long-term, apart from the $200 million earmarked for the Growler acquisition. That said, there’s more likelihood of the DMO actually being able to spend a more evenly distributed budget rather than eking out a living for a while and suddenly splurging.

Table 2. Capital investment budget (major projects + minor projects + capital facilities) – all figures in billions of dollars.

Table 2. Capital investment budget (major projects + minor projects + capital facilities)

Sources: Defence PBS 2012-13 and 2013-14. Read more

Table of the week – recent defence budgets

As Graeme Dobell’s account of Defence Minister Stephen Smith’s speech suggests, there was scepticism in the audience about his claim that the defence budget over the past twelve years averaged out at a little over 1.7% of GDP.

The data is shown in the table, reproduced from Mark Thomson’s 2012–13 Cost of Defence report (page 26).

The average from 2001–02 to this year is, as advertised, 1.763%.

Net Defence funding as a percentage of GDP

(Click table to enlarge.)

Sources: 2012-13 Budget Overview, 2012-13 Defence Portfolio Budget Statements and earlier Defence Annual Reports.

Andrew Davies is senior analyst for defence capability at ASPI and executive editor of The Strategist.

Hard times

Hard times: then and now

Earlier today, I took up an invitation to speak at the annual Australian Defence Magazine Congress. My task was to provide an update on the defence budget and make predictions about where it’s headed. The first part was easy, the second less so. Here’s an outline of what I said.

Where are we now?

In May 2009 the government released an ambition blueprint for the ADF of the future—Force 2030—accompanied by a 21-year funding commitment and a decade-long $2 billion Strategic Reform Program (SRP). The funding commitment lasted all of 10 days, before $8.8 billion of promised funding was ‘reprogrammed’ (i.e. deferred) to beyond 2016 in the 2009–10 Budget. (That budget is examined in grisly detail here.)

Over the next three Budgets, Defence went on a wild ride. When the dust settled in May last year, Defence had seen a further $1.8 billion of promised funding deferred, had handed back $1.6 billion in unspent funds, absorbed $2.5 billion in unfunded measures and copped a demand to find an extra $10 billion of new savings (i.e. reduced funding) above and beyond the SRP. All up, since the publication of the 2009 White Paper, $25 billion of scheduled White Paper funding has been lost one way or another. Read more

The NSS: a strategy within a strategy

A strategy within a strategy within a strategy

Last week’s National Security Strategy has attracted a mixed reaction, with many commentators focussing (rightly) on the vagueness of the document and the lack of any concrete spending commitments.

But the PM’s speech on launching the paper was rather more concrete. In particular, she emphasised three big changes in Australia’s strategic environment: a swing back to focusing on states rather than non-state actors, on our region rather than the world, and on diplomacy over other alternatives.

I think she’s right on each of these. The tensions between China and Japan over the Senkaku Islands, and between China and almost everyone in the South China Sea, are good examples. Both are all about states, all about our region (and particularly maritime sea lanes and freedom of passage, perhaps the most crucial security issue for Australia) and (hopefully) both can be resolved diplomatically. If not, we’re in trouble. Read more

Graph(s) of the week: expensive ships or a big fleet – you may only pick one

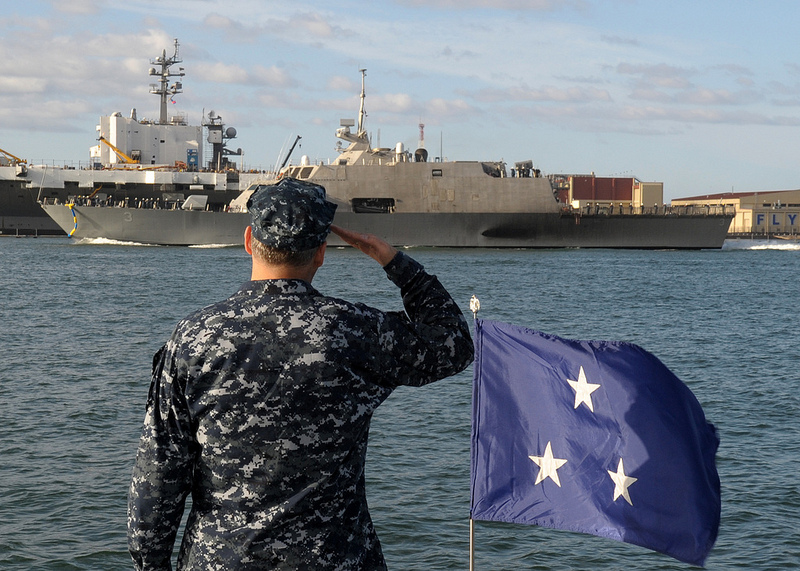
SAN DIEGO (Oct. 18, 2012) Vice Adm. Tom Copeman, commander of Naval Surface Force, U.S. Pacific Fleet, renders a salute during a pass in review by the Freedom-class littoral combat ship USS Fort Worth (LCS 3) as she arrives in San Diego. Fort Worth was commissioned Sept. 22, 2012, in Galveston, Texas, and will be assigned to U.S. Pacific Fleet.

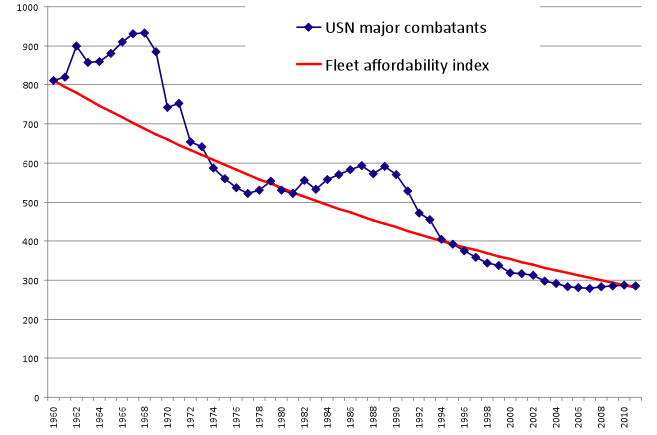
For the first graph of 2013 we’re going back to a topic that has been exercising the minds of force planners around the world for decades: how can we keep up with the rising unit cost of military platforms? The short answer is ‘we can’t’, except by expending an ever greater proportion of national wealth on military equipment, and the graphs below tell the story.

In the first figure, the blue data points are the number of major combatants in the USN from 1960 to the current date. The red line—labelled the ‘fleet affordability index’—is the number of vessels that would be expected if the USN had fixed buying power across the period. It shows how the USN’s fleet would be expected to decline if the sole driver was the increasing cost of vessels. It’s calculated by taking the RAND Corporation’s estimate of the increasing real cost of naval vessels—a 2.1% real increase per annum—and compounding it. As the curve shows, the USN bucked the trend for a while as the Vietnam War was at its peak in the late 1960s, and again in the Reagan build-up years of the 1980s. But economics has a habit of coming back to bite, and as defence spending returns to the long term trend, so too the fleet size inexorably heads back towards the ‘line of fixed buying power’ represented by the fleet affordability index.

Sources: USN fleet size from http://www.history.navy.mil/branches/org9-4.htm. Cost index curve from RAND Corporation estimates of unit price increase.Sources: USN fleet size from http://www.history.navy.mil/branches/org9-4.htm. Cost index curve from RAND Corporation estimates of unit price increase.

Read more