Tag Archive for: Budget

Government must rethink funding model to support technology in Australia’s public sector

In the modern economy, all companies are software organisations, whether they realise it or not. So too Australia’s federal government. But how the government works, how it accounts for money and allocates funds, have not kept pace with the modern world of technology—in particular, the integration of data and digital systems in everyday life. That’s not unexpected. Companies, too, are still coming to terms with that world. And our government—through habit and function—is highly risk-averse. As it should be; after all, people depend on it to get things right.

However, the government is also responsible for setting the guardrails for the use of technology by others through policy and regulation.

It matters to citizens and businesses that the government is sufficiently familiar with and experienced in using modern technologies, because that knowledge shapes government policies affecting our wellbeing. That’s why a number of technology companies have offered to brief the Australian Taxation Office on the importance of software development to research.

Just as troubling, outdated technologies and practices increase the vulnerability to attack and the chance of failure of government systems and data—our data. And as technology plays into geopolitics, such weaknesses erode Australia’s strategic posture.

What to do? Let’s start with considering possible changes to the government’s funding of its own technological capability and systems.

The first change must surely be ideational. Governments are inclined to see technology primarily through the lens of efficiency. And over time, technological improvements do lower costs. But that risks missing opportunities to explore new ways of doing business, which often require additional short-term support for long-term gain. Such an approach pinches pennies in terms of the improvements and reserves needed for secure and resilient organisations.

Rather than efficiency serving as the mainstay of arguments for funding, other principles can help set priorities. For example, the focus could be on building government technology and the public service’s skill sets as part of Australia’s sovereign capability; placing people at the absolute centre of decisions—what works for them, what doesn’t—and promoting individual agency; and choosing technologies that best support Australia as a liberal, free-market democracy.

Prime Minister Scott Morrison can take the lead here. He can decide to make such principles a policy mainstay in the upcoming Budget, evidence of action aligned with the recent Quad summit. He can reiterate those principles when writing to ministers in September asking for their proposals for the next Budget. Most importantly, such principles can be embedded in the budget process and operations rules, which are agreed by cabinet each year preceding the commencement of the new budget round.

In short, seeing technology as a broader enabler and not merely a cost-cutter would be empowering. But by itself, that wouldn’t be enough. Alternative principles would still have to compete with the brutal impetus of the efficiency divided (ED) and the offset rule. That’s because money shapes behaviour. And, frankly, the original reasons for both the ED and the offset rule remain: to drive continued efficiencies in government, which has a tendency, for good reasons and bad, to expand; and to exert discipline on ministers who would otherwise spend without saving. However, both policies, as I argued last month, have unintended consequences.

Simply exempting technology programs from the ED wouldn’t prevent cross-subsidisation and cannibalisation, especially when offsets are sought. Nor would it provide an incentive to modernise operations and practices within departments.

Still, there may be options to use both the ED and the offset rule for good.

For example, technology expenditure by agencies could be explicitly broken down into capital expenditure (CAPEX) and operating expenditure (OPEX) components and managed in a similar way to agencies’ administrative budgets. That would give agencies the flexibility to manage funding over the lives of projects and of systems, with similar reporting as for administrative budgets. And any ED savings could then be redirected explicitly to support the transformation and modernisation of core agency operations.

That would enable a virtuous cycle: technology transformation helps generate efficiencies, and efficiency savings help modernise technology to help agencies get smarter at what they do.

Having greater transparency in a technology budget would discourage ministers and portfolio departments from using technology maintenance and upkeep as a means of offsetting new policy proposals. If the government is serious about modernising and securing IT systems, it has to think of technology not as a burden—a cost centre to be harvested—but as an investment that will pay dividends into the future.

And, realistically, redirecting ED savings for technology modernisation alone is unlikely to be enough given the current fragmented, competing and depleted technology stacks, capability and governance across the public sector.

Perhaps the government should consider a separate technology fund, established outside normal portfolio lines, to reduce technical debt, focus on digital uplift, allow coherent security practices across portfolios, and build and manage the underlying sovereign technology asset base for government. A separate funding mechanism or entity could offer scope to innovate and to build the cadre of skilled engineers and social scientists needed to generate those public goods that only the government is well placed to offer.

The size of such a fund should not be underestimated. It would need to be big enough to claw back the erosion of assets and capability that have occurred ever since the Gershon reforms to government information technology and the effects of financial framework decisions such as Operation Sunlight, the loss of depreciation funding, the cuts to departmental capital budgets and, most recently, the imposition of the ED on CAPEX.

There is no silver bullet to improve government technology, and here only the funding aspects have been addressed. Nonetheless, given the need to rebuild post-pandemic, if those changes can’t be implemented now, to modernise government systems and services and position the public service for a world of increasing digitalisation and technological competition, then when?

Budget rules erode Australian government’s capacity to embrace technology

An evergreen question posed by ministers and commentators in Australia is why we haven’t seen government operations and service delivery shift to a more agile, cloud-based system.

Late last year, Matt Yannopolous, head of the budget group in the Department of Finance, set out the mechanisms that allow agencies to move to cheaper, more agile ways of developing and deploying services, especially using the cloud.

But decisions about technology systems, about the movement of funds between years to accommodate needs or technological change, and about the conversion between capital funding and operating funding to enable flexibility are neither clear nor easy.

Every instance of material spending on information and technology projects is subjected to a range of checks and balances. Yet the nature of these processes and the effort required to complete them make it difficult to meet government, community and industry expectations of a modern, agile public service.

There is the ICT investment ‘two-pass’ process: each project spending over $10 million in total has to have its activities, costs, assumptions and anticipated benefits agreed by government twice. The first is a rough estimate; the second is much more exacting. The process typically takes around 18 months—potentially two to three generations of technology—assuming cabinet agreement.

Once approved, projects are subject to a series of gateway reviews, intermittent assessments of progress on project delivery and realisation of cabinet-agreed benefits. They are aimed at managing risk, can be formulaic and may impede adaptation to new ideas and technologies as they emerge.

And then there’s the broader fiscal context. Within the budget process are policies and practices that constrain agencies. Most are good financial management—correctly allocating and accounting for capital and operating expenditure, for example, in accordance with government decisions and accounting standards.

But there are also practices and policies within the budget process that create perverse incentives. Bear with me: it’s complicated.

Let’s start with the ‘efficiency dividend’ (ED). The ED is applied each Budget, meaning that, with some exceptions, the government reduces each agency’s operating expenditure (OPEX) by 1.5% each year, often portrayed as ‘savings’. That percentage can vary, depending on government decisions about the clawback needed to support budget outcomes, but typically it’s around 1% to 1.5%, though it has reached 2.5% on occasion, as a ‘one-off’.  In the 2019 Mid-Year Economic Forecast and Outlook (MYEFO), the ED was extended to include capital budgets, unless explicitly excluded.

Then there’s the ‘offset rule’. Funding for any new idea—called a ‘new policy proposal’—has to be offset by savings within the portfolio. That means the portfolio department often has to scrounge within its own budget or the budgets of agencies in its portfolio to find enough money to fund the new idea. The government rarely agrees to cease an activity—governments don’t like disappointing stakeholders—and so departments work to deliver projects and services on ever thinning lines of funding and capability.

Between inflationary pressures, new policies, offsets and the constant stress of the ED, there’s little flexibility in OPEX. Bear in mind that cloud computing services—and associated business changes—are funded through OPEX, not capital expenditure.

So, what is capital funding for? CAPEX is the money spent on assets such as buildings (including fit-outs but not rent), military equipment, plant and ICT infrastructure. CAPEX is handled differently to OPEX, as set out in accounting standards. Capital equipment may be depreciated and contributes to the asset side of the ledger. The idea is that organisations will put aside cash to the value of depreciation so that they can replace assets once they are fully depreciated.

The federal government is different. In 2010–11, under ‘Operation Sunlight’, it changed its rules, eliminating depreciation funding and replacing it with departmental capital budgets (DCBs). Then, in the 2011 MYEFO, DCBs were slashed by 20%. Most agencies kept some capital funding for small works—projects under $10 million—needed to manage ongoing operations.

That capital funding is now further eroded by the imposition of the ED. If a large capital asset, or a multiplicity of smaller systems, need replacing, then rather than relying on its own resources, an agency has to seek funding as a new policy proposal through the budget process.

But seeking support funding through the budget process is problematic. Pursuing a new policy proposal requires a persuasive argument, considerable grit—the process can be brutal and getting through two passes can take 18 months, if not longer—and, importantly, political backing.

There are always more proposals than available funding. Successful proposals funded in each Budget—known as ‘measures’—typically account for only around 1% of the government’s annual expenditure. Crises—pandemics, cyberattacks, bushfires—can elicit some extra funding. Technology renewal will be well down the list of attractive proposals.

Also, funding for new proposals has to be drawn from somewhere. The outcome of the offset rule, meant to help manage the Budget, is prioritisation through cannibalisation. The overall effect is to dilute capability, reduce resilience and increase technological vulnerability. That reinforces the common and simplistic view of government ICT as a motley collection of ill-disciplined cost centres, rather than an enabler intrinsic to government business.

While it may seem that all the incentives exist to shift government systems to the cloud, it’s often the reverse. Cuts to the DCB and the imposition of the ED on OPEX and CAPEX make it hard to fund small, more manageable, less risky transitions and associated change management. Swapping from CAPEX to OPEX is also much less attractive, even allowing for the arduous process of writing to ministers, when the ‘savings’ may be conscripted for other purposes and returns are uncertain.

Such fiscal and operational pressures make agencies susceptible to bids by major service and technology providers for outsourcing, relieving government of the burden of technology.

That, however, has undesirable consequences. It further erodes an already diminished capability within agencies to understand and make sound decisions about technology. It decreases transparency and accountability around technologies that directly affect people’s lives. It increases the prospect of capture by and dependency on the technology and values of others, diminishing sovereignty. And it erodes national assets and the balance sheet.

The risk confronting the government is less about a reluctance to move to the cloud. Rather, it is Michael Lewis’s fifth risk: ‘The risk a society runs when it falls into the habit of responding to long-term risks with short-term solutions.’

Digital technology is intrinsic to government operations and service delivery and the government’s interactions with citizens. The government has to learn to be a smart and savvy manager of technology in a world of accelerating technological competition while overcoming its own fragility and emaciation. Until the government’s incentives and processes are aligned with that intent, it will remain a technology laggard, and economic wellbeing, public needs and national security will suffer.

Fifty years of Foreign Affairs: the anaemia problem

Anaemia: Lacking enough healthy red blood cells to carry adequate oxygen to the body, making the patient tired and weak. Anaemia can be temporary or long term and can range from mild to severe.

For a bureaucracy, money is oxygen and people are blood cells.

And anaemia has been a recurring affliction for Australia’s Foreign Affairs Department since it was born in November 1970, casting off its old moniker, External Affairs.

The Department of Foreign Affairs and Trade has grown into a great department of state, yet warnings about the impact of anaemia on its work and effectiveness are a persistent motif over 50 years.

The template for the dire diagnosis was set by the 1986 review of Australia’s overseas representation, authored by the department’s secretary, Stuart Harris.

As a medium-sized country with limited economic and military power, Australia must rely heavily on persuasion to achieve its vital overseas objectives, Harris wrote, yet the ‘capacity to do this is thin and becoming thinner’. Australia accepted the need ‘to spend substantially to maintain an orthodox defence capacity’ yet wouldn’t do the same for diplomacy. The pressure on most areas of overseas representation led to Australia’s ‘falling short of our capacity to achieve some of our international objectives’.

When the Lowy Institute reported on Australia’s ‘diplomatic deficit’ in 2009, it found that DFAT’s overseas missions were ‘overstretched and hollowed out’. Years of underfunding had diminished the department’s ‘policy capacity and rendered many overseas missions critically overstretched’. The ever-rising consular workload had displaced ‘our diplomats’ capacity to contribute to wider national objectives’. By international standards, Australia operated a disproportionately small diplomatic network. And ‘language skills of DFAT staff have been in decline over the last two decades’.

Returning to the ‘diplomatic disrepair’ case in 2011, Lowy found that Australia’s traditional diplomatic footprint was outdated and inadequate: ‘Both political parties are to blame. Unless these deficiencies are remedied, our economic, political and security interests could be seriously jeopardised.’

The Lowy disrepair report revealed that DFAT’s overseas network had shrunk by 37% over two decades ago, despite ‘massive growth in the Australian public service (60% in 15 years)’. The government should reduce staff numbers in Canberra to get more of our diplomats overseas, the report said, and prevent further erosion of DFAT’s policy and diplomatic capacity by reviewing the way consular services are delivered and funded.

Parliament’s joint foreign affairs committee concluded in 2012 that DFAT had suffered ‘chronic underfunding’ for the previous three decades. The diplomatic network was ‘seriously deficient’ because of cuts imposed by successive governments: ‘Australia has the smallest diplomatic network of the G20 countries and sits at 25th in comparison to the 34 nations of the OECD. Australia clearly is punching below its weight.’

When the Public Service Commission did a capability review in 2013, it described DFAT as a ‘strong and agile’ organisation with ‘great potential to deliver more to the government and to the Australian community’. So the great department wasn’t quite delivering. ‘In the view of its own staff and others’, the review reported, ‘DFAT is more effective at advocacy and delivery than at strategic thinking.’

The capability review set out the anaemia problem by listing the department’s challenges, expressing them as the obverse of its strengths. The commission’s strengths-versus-challenges list is a description of a department needing to get more oxygen to its blood cells:

  • loyalty of staff to department versus ‘institutional insularity’
  • flexibility of workforce versus ‘churn and poor workforce planning’
  • talented generalists versus ‘strains on specialisation’
  • excellence of overseas networks versus a department that’s ‘less effective in Canberra’
  • excellent delivery in a crisis and a ‘can-do’ approach versus suspicion of prioritisation and strategic planning
  • high responsiveness to ministers versus ‘less clearly articulated departmental views’
  • effective advocacy of existing policy versus ‘less good at policy development’.

The federal budget maps the trend. In 1949, the combined budget for diplomacy, trade and aid was almost 9% of the federal budget, reducing to 3.2% by 1969, 1.9% by 1989, 1.5% by 2009, and then down to the current 1.3%. The figures are from Melissa Conley Tyler’s report for Australian Foreign Affairs on systematic underfunding. As she comments:

Since 2013, Australia’s total diplomatic, trade and aid budgets have fallen from 1.5% of the federal budget to 1.3%. In pure dollar terms, this is a fall from A$8.3 billion to A$6.7 billion. At the same time, the budgets for defence, intelligence and security have ballooned. In the almost two decades since the September 11 terror attacks, the Department of Defence budget has increased by 291%, while the allocation for the Australian Security Intelligence Organisation has grown by 528% and the Australian Secret Intelligence Service by 578%.

Busy doing urgent business, DFAT rightly worries that it’s letting important business slide. Busy is understandable when there’s a diverse range of responsibilities: bilateral and multilateral, high and low policy, plus all the functions of a service department.

This conglomerate bureaucracy does high policy (diplomacy, strategy and security interests); low policy (trade and economic interests); a $4 billion aid program that proves the old high–low policy distinction is pretty meaningless; issues 1.7 million passports annually, with 1,400 active consular cases on any one day; and at its embassies and missions, manages security, estates, information and communication, including hosting 30 Commonwealth departments, agencies or entities that have staff in Oz overseas posts. The conglomerate has four agencies that do trade and investment, international agricultural research, spying and tourism.

The Public Service Commission review said DFAT knew it had a ‘serious problem’ sharing its knowledge with other departments and was too detached from the rest of the public service. DFAT ‘should play more of a central agency-type role’ in shaping international political, economic or strategic policies:

DFAT is not seen by other government agencies, or by some of its own people, as performing as well in Canberra as it does overseas. It is perceived as being distant from policy processes outside traditional national security and trade areas, even on issues like the global economy or energy where it has something to bring to the table.

To extend the anaemia metaphor, the heart of DFAT’s problem is in the rest of Canberra that surrounds its R.G. Casey Building headquarters.

Government fund won’t stop Australian manufacturing’s structural decline

The federal government sees the revival of Australian manufacturing as a matter of economic sovereignty, yet the annual national accounts highlight the enormity of the task it confronts.

The government is establishing a $1.3 billion fund to cover up to a third of the cost of expanding a manufacturing plant to achieve economies of scale and up to half of the cost of projects to integrate products into global supply chains or bring new research into production.

While there have been numerous government subsidy programs for manufacturers over the years, the investment fund concept is new and appears to be modelled on the Clean Energy Finance Corporation which has supported the expansion of solar and wind energy projects.

There is déjà vu in the six priority sectors identified by the government that will be eligible for the new funding, which encompass resources, food and beverages, medical products, recycling and clean energy, defence, and space.

The Abbott government’s 2014 industry plan established ‘growth centres’ for food and agribusiness, mining equipment, energy resources, medical technologies and advanced manufacturing.

Indeed, the revival of manufacturing has been an ambition of successive governments. On being made leader of the Labor Party in 2007, Kevin Rudd memorably declared, ‘I don’t want to be a prime minister of a country that doesn’t make things anymore.’

As it happened, the Rudd government’s first year in office in 2008 marked the peak for manufacturing output, with the sector contributing $119.5 billion to GDP. The annual value of manufacturing production has dropped since then by $14.2 billion (after allowing for inflation).

Manufacturing has been falling as a share of the economy for a lot longer than that, having peaked at more than 25% in the 1970s compared to just 5.5% now, but it’s only over the past 12 years that the sector’s actual output has dropped. Manufacturing was 40% larger than the resources industry, measured by its value added, in Rudd’s first year, but is now only two-thirds its size.

The decline is destined to continue because investment has not even been keeping pace with the depreciation of existing plant and equipment, let alone providing a base for future growth.

The value of machinery and equipment owned by manufacturing companies has fallen by $20 billion, a drop of 26%, since 2008 (again after allowing for inflation). This includes a 14% fall in IT hardware and a 32% drop in other electronic and electric equipment.

This collapse has been precipitated by the iron law of market economies that says money and labour will flow to where the returns are greatest. And, over the past decade and a half, that has been to the resources and services sectors.

The gains from the China-fuelled resources boom are obvious, but a perceptive comment by veteran industry analyst Phil Ruthven highlights the advantages of the services sector over manufacturing:

The money exchanged from the time of production to consumption is much quicker, so there is a multiplier effect. You pay for breakfast in the morning, the waiter spends it visiting a doctor, the GP pays to get his lawn mown, and the gardener goes to the cinema that night. Try making and selling goods four times in a day.

Manufacturing in Australia suffers from inescapable problems of distance from major markets and lack of scale, which mean it cannot overcome the disadvantage of its high labour costs, as do manufacturers in countries like Germany and Japan.

Australian manufacturers are not hooked into the value chains that have reshaped global industry, with components made or assembled in different countries. The iPhone, for example, draws on components produced by 785 suppliers in 31 countries. As much as half of the value of China’s exports is generated in other countries which sell to China for assembly or further processing. For Australia, the import content of our exports is less than 20%.

OECD research shows that to the extent Australian manufacturers form part of global value chains, they provide only the first links, exporting processed raw materials. Businesses do not send goods to Australia for further processing.

The OECD says, ‘Australian manufacturing stands out as overall being less competitive’; it has an edge in only a small number of niches, such as non-ferrous metals, pulp and woodchips, and food and beverages—all low-technology industries.

Competitive high-technology industries in Australia, such as pharmaceuticals, reflect multinational enterprises establishing local content in part to gain access to government procurement.

While the outlook for the manufacturing sector is bleak, it is not uniformly so. Australia has numerous highly successful manufacturers including some that are world class. While the government rightly commends the achievements of advanced manufacturers like Cochlear, CSL and Austal, some of the most outstanding successes have been in relatively low-technology areas.

The global packaging business of the Visy Group has its base in making cardboard boxes, while Brambles turned the humble pallet into a global logistics enterprise. Ansell transformed its rubber glove business into the world’s biggest pure supplier of personal protective equipment with operations in 55 countries.

Picking winners, as the government proposes, is a fraught but not necessarily futile exercise that can deliver material benefits to the recipients of its largesse. The Clean Energy Finance Corporation is now seen as a success on both sides of politics. But the new initiative is not offering nearly enough to alter the allocation of capital which is at the root of manufacturing’s decline.

Ponying up: Has the government met its defence funding commitments?

In my initial analysis of the 2019–20 Defence budget, I suggested that in the four budgets since the 2016 defence white paper, the actual funding that the government has provided to Defence has come remarkably close to its white paper commitment. In the interests of full disclosure and accountability, I should note that in ASPI’s 2018–19 The cost of defence budget brief I stated the opposite, namely that the government had fallen short of its commitment. So which is it?

Let’s first look at what the commitment actually is. While a lot of attention is paid to the government’s commitment to increase the defence budget to 2% of GDP by 2020–21, the white paper also presented a 10-year fixed funding line to avoid the defence budget going up and down as GDP predictions fluctuated. It stated that ‘this de-coupling from GDP forecasts will avoid the need to have to regularly adjust Defence’s force structure plans in responses to fluctuations in Australia’s GDP’.

In essence, the government guaranteed funding stability so Defence could get on with delivering the future force. This is what the first four years of the white paper funding model look like (page 180):

Table 1: White paper funding model ($ million)

2016–17 2017–18 2018–19 2019–20 Total
White paper funding 32,374 34,199 36,769 39,086 142,428

Historically, governments don’t have a great record of meeting their white paper funding commitments. We’ve now reached the final year of the 2016–17 budget’s forward estimates period. That was the budget that immediately followed the 2016 white paper and started the delivery of its commitments. That means we have a four-year body of evidence to examine what the picture looks like this time around.

The first thing that changes our analysis from last year is the fact that the appropriation for the Defence portfolio (that is, both the Department of Defence and the Australian Signals Directorate)  has changed. If we compare the 2018–19 portfolio budget statements with the 2019–20 PBS, the actual allocation has increased by a total of $1,882 million in 2018–19 and 2019–20 (see table 2). So we should bear in mind that 2019–20’s funding could still change.

Table 2: Defence funding—2018–19 PBS versus 2019–20 PBS ($ million)

2018–19 2019–20
Allocation in 2018–19 PBS 36,356 38,070
Allocation in 2019–20 PBS 37,566 38,742
Increase 1,210 672

But answering the question is not quite as simple as comparing Defence’s actual funding presented in successive budget statements to the white paper line. That’s because lots of variations to Defence’s funding occur. Some can be neutral in effect even if the numbers are big; others are the result of the government deciding to reprioritise and move funds into or out of Defence. The variations for Defence are laid out in tables in the PBS and mid-year portfolio additional estimates statements (PAES).

To give a complete picture, we need to take all variations into account. Last year we only took supplementation for operations into account, which resulted in an incomplete assessment.

So, the second factor that changes our analysis is that this time we have gone through all variations in the Defence PBS and PAES since the white paper. At least, we have gone through all of the ones that are made public; the PBS and PAES include variations that are marked ‘not for publication’ for either security or commercial reasons for which no numbers are given.

The total visible variations for the Defence portfolio are as follows:

Table 3: Total variations to the Defence budget since the 2016 white paper ($ million)

2016–17 2017–18 2018–19 2019–20 Total
Foreign exchange adjustments –548 –724 –192 –90 –1,554
Supplementation for operations 652 850 752 704 2,958
Reprofiling –500 1,000 414 –714 200
All other variations –49 –221 –240 –251 –761
Total variations –445 905 734 –351 843

This list doesn’t factor in the transfer of $1.67 billion over 2018–19 and 2019–20 from Defence to ASD when the latter was established as a separate agency within the Defence portfolio. While these are a variation for the Defence Department budget, we are interested in a portfolio view because that’s what the white paper presented, and those ASD funds remain within the portfolio.

If we adjust the original white paper funding line to incorporate those variations, we get:

Table 4: Adjusted 2016 white paper funding line ($ million)

2016–17 2017–18 2018–19 2019–20 Total
White paper funding line adjusted for variations 31,929 35,104 37,503 38,735 143,271

For the government to meet its funding commitments, actual funding has to equal or exceed the adjusted white paper funding line. And it comes pretty close:

Table 5: Defence funding surplus against 2016 white paper ($ million)

2016–17 2017–18 2018–19 2019–20 Total
White paper funding line adjusted for variations 31,929 35,104 37,503 38,735 143,271
Actual allocation 31,999 34,926 37,566 38,742 143,233
Actual surplus against white paper 70 –178 63 7 –38

It misses by only $38 million total over the forward estimates (that’s 0.03%), and most of that was in 2017–18. The other three years were a little over. By historical standards, that’s very good.

It’s reasonable to ask whether the variations are legitimate. So let’s look at them a little more closely, starting with table 3.

Foreign exchange adjustments preserve Defence’s buying power on a no-win, no-loss basis, so even the reduction of $1.5 billion isn’t effectively a budget cut. The nearly $3 billion in operational supplementation covers the actual cost of operations beyond Defence’s usual activities and is also no-win, no-loss, so it’s not effectively a budget increase.

The reprofiling of funds simply moves money forward or back. We haven’t seen any of the big reprofiling of money out into the distant future that has sometimes occurred in the Defence budget. In fact, over the four years we’re looking at, Defence comes out a little ahead in reprofiling terms. So, despite some big numbers, all three of those categories are essentially neutral.

That leaves $761 million in other variations. This is where things get a little subjective. They can be broken down as follows:

Table 6: Other Defence budget variations ($ million)

2016–17 2017–18 2018–19 2019–20 Total
Cybersecurity
(2016–17 PBS)
–24 –34 –33 –32 –122
Public sector transformation and the efficiency dividend
(2016–17 PAES)
0 –58 –102 –130 –289
Department of Defence–efficiencies
(2017–18 PBS)
–70 –72 –76 –86 –304
Remaining variations 44 –57 –30 –3 –46

Under the first of these measures, Defence had to provide $122 million to fund the government’s cybersecurity strategy. In the 2016–17 PAES Defence had to give up $289 million as an efficiency dividend, and in the 2017–18 budget (page 79) Defence had to achieve $304 million in efficiencies, mainly through ‘reductions in the number of consultants and contractors’. So that’s a total of $593 million in reductions to be funded through ‘efficiencies’. The remaining $46 million is small beer.

You can argue whether these variations are legitimate or just Defence being used as the cash cow to fund other government priorities. But cybersecurity is important and many other agencies have had to accept previous efficiency rounds that Defence escaped.

Legitimate variations or not, actual funding missed the target by only $38 million over four years, as noted in table 5. But if you think the variations represent cash stripped out of the Defence budget, then the white paper target should have been $761 million higher. In that interpretation, actual funding fell short by $799 million, or about 0.5%. Either way, though, actual funding is still extremely close to the white paper target. Any secretary of defence or chief of the defence force would be very happy with that outcome.

One limitation in this analysis is the variations marked ‘not for publication’. Some of these could be quite large, such as equity injections into Australian Naval Infrastructure Pty Ltd, which was split off from ASC to build and manage the naval shipyards in Adelaide. The government has consistently given a cost of $535 million for the frigate shipyard (the submarine yard will be additional to that), but it’s not clear how much of that is being funded by Defence and how much by the Department of Finance, which owns ANI. So the analysis here is not complete. These variations could also go some way to explaining the discrepancy between the white paper and actual funding.

That caveat aside, from the evidence we can see, over the four budget years since the 2016 defence white paper, the government has delivered on its funding commitment.

Of course, how much funding Defence gets is a different issue from whether that funding is being spent effectively. I’ll look at that question in detail in ASPI’s The cost of defence budget brief for 2019–20, which will appear after the election, on Wednesday 5 June.

Boring is the new black: Defence budget 2019–20

The Defence budget continues to deliver as expected. As forecast last year, there will be a modest increase in 2019–20 of around 1.2% in real terms, to $38,742 million (including both the Department of Defence and the Australian Signals Directorate).

That won’t get defence funding any closer to the promised land of 2% of GDP. It’s still hovering a little over 1.9%, leaving it to the next government to commit to a final jump of a further $3 billion in 2020–21— an increase of more than 5% in real terms—to hit the magical 2%.

But we should remember that the 2016 defence white paper laid out a 10-year fixed funding line (page 180) to avoid the ups and downs and resultant planning headaches that can arise from tying funding to a flighty thing such as GDP. The 2019–20 budget year corresponds to the final year of the forward estimates period in the 2016–17 budget, the one that presented the first four years of the funding plan to deliver the white paper, so it’s fitting to examine whether the government has met that funding commitment.

The short answer is, it has. Once all the myriad variations that were made between then and now are taken into account—including supplemental funding for operations; no-win, no-loss foreign exchange rate adjustments; and dollars reprofiled left and right—actual defence funding has come in remarkably close to the government’s 2016 commitment: an initial analysis suggests it’s within 1%.

Some of the funding moving left or right might not have been optimal for Defence, but it’s manageable. This year’s budget, for example, moves $620 million from 2019–20 into 2018–19. With the F-35 joint strike fighter program spending around $2 billion last year and $2.5 billion this year (page 109), Defence can handle that simply by adjusting the payment date on a cheque by a month or two. It’s hard to think of a time when Defence, and by default its industry partners, have had the luxury of such consistency and reliability in the department’s funding. A boring budget is good for planning and delivering.

Shipbuilding and other key projects are continuing to ramp up methodically. The future frigates’ spend goes from $222 million in 2018–19 to $468 million in 2019–20 (page 117) and offshore patrol vessels from $221 million to $349 million (page 118). The only hitch in a document otherwise devoid of drama appeared to be the future submarines going backwards from $456 million to $289 million (page 118), but Defence advises that the published number doesn’t include the latest government funding approvals. Once those numbers are added in, the predicted spend for 2019–20 is in the order of $750 million.

Defence and industry are going to need all of that funding. Australian shipbuilding projects now total $2 billion in annual cash flow, and that’s before the two big kids on the block, the future frigates and submarines, have cut steel. Including recent government approvals, those two projects’ approved budgets now total around $12 billion—and that’s just for design and mobilisation. Construction is on top of that. In last year’s Defence budget brief (page 22), ASPI predicted that Defence will have spent over $20 billion between those two programs before the first of each class becomes operational. It’s looking like we underestimated that number.

Capital spending continues to grow. Overall facilities spending has virtually doubled between the first and second halves of the current decade. Nevertheless, one area of consistency which is a cause for concern is that over each of the past four years Defence has underachieved against the big capital funding increases built into the budget. It will come up around $5 billion, or 11%, short against the 2016–17 budget’s forward estimates. Exchange rate variations can account for some of that, but certainly not all. Setting up and delivering major projects takes time. The government and Defence have done well to achieve actual capital spending growth of 6.3% and 8.8% over the past two years, but the leaps of 21.8% growth in 2020–21 and 18.4% in 2021–22 planned for the capital budget seem quixotic (should the next government stick with that plan).

Personnel numbers are slowly but steadily increasing. The army seems to have suffered a slight hiccup in 2018–19 but, importantly, the navy has turned things around and is heading in the right direction. Sustainment spending also continues to ramp up at a steady rate.

On sustainment, last year ASPI argued (page 43) that one of the big risks was the cost of the F-35A. The JSF program was aiming for a sustainment cost similar to that for legacy aircraft such as the classic Hornet. But if the cost of sustaining the JSF turned out to be more like the costs for the Super Hornet and Growler electronic attack aircraft, the sustainment budget would be under pressure. The 2019–20 budget sheds some light on things: for the first time, the F-35A puts in an appearance in the top 30 sustainment products table. At $41,800 per flying hour in 2019–20, it’s between the classic Hornets at $22,200 and the Super Hornets/Growlers at $79,000 (that’s derived by dividing the sustainment costs (pages 122–123) by annual flying hours (page 65)). It’s early days, so hopefully that will come down as the sustainment system matures.

The picture with operations is also stable. Operations funding decreases from $792.7 million in 2018–19 to $703.6 million in 2019–20, mainly accounted for by moderate decreases in Operations Accordion (Middle East) and Okra (Iraq), and the one-off outlay of $40.1 million for Operation Augury (support to the Armed Forces of the Philippines during the siege of Marawi) not continuing. There are no operations with substantial funding growth, which indicates that the government isn’t currently planning any increased operational commitments.

Kudos should go to the hard-working public servants across Defence who brought together the budget despite losing five weeks of what is already a hectic schedule. It appears as solid and reliable a document as ever.

But with the ANAO having recently announced an audit of the ‘Commonwealth resource management framework and the clear read principle’, is it churlish to ask whether the document conforms to that principle?

On Tuesday, the ministers for defence and defence industry announced an allocation of $38.7 billion to Defence in 2019–20, but nowhere in the portfolio budget statement tables is there a single line item where that number can be found.* Surely more can be done to give the public a clearer, more accessible understanding of how their defence dollars are being spent?

Note: ASPI will release its annual The Cost of Defence budget brief on 5 June. It will include analysis of the next government’s election commitments in addition to our standard Defence budget analysis.

* In case you’re wondering, it’s derived from serial 4 of table 1, which is the Defence Department’s top-level resourcing table, combined with two lines from table 66, namely ‘Appropriations’ and ‘Appropriations—contributed equity’, which is the Australian Signal Directorate’s cash-flow table. Fortunately, I had three helpful Defence Department officials in the budget lock-up to guide me. The average citizen isn’t so lucky.

Budget 2017: national security

Image courtesy of Flickr user Yu Tung Brian Chan.

National security received a higher level of Budget attention than usual this week with Monday’s announcement of $321.4 million funding over four years for the AFP. However, announcing this the day before the Budget attracted allegations that the Turnbull government had planted a good news story to distract attention from some of the more politically sensitive budget decisions. You could argue that this relatively small funding announcement needed its own platform to make an impact: $300 million doesn’t rate among a day of billion dollar announcements. More importantly, what does Budget 2017 mean for the state of national security funding and capability overall?

The new financial injection is sorely needed. The AFP experienced a golden age of growth in the aftermath of the 2002 Bali bombings, building critical investigative and technical capability as well as developing its renowned international role. The establishment of the International Deployment Group, the Australian Bomb Data Centre (now part of the AFP Forensics Centre) and the multinational Jakarta Centre for Law Enforcement Cooperation all took place in the years following the Bali attack. Other Commonwealth agencies involved in CT, including ASIO and ASIS, also received a budget boost, while states and territories received additional capability and training funding under the auspices of the Australia and New Zealand Counter Terrorism Committee.

But the financing which supported this initial rapid growth for the AFP and more broadly for CT has declined in recent years. That has occurred despite the increased terrorist threat, and the growth of organised crime and new crime types such as online fraud. AFP Commissioner Andrew Colvin recently warned a Senate Committee that without increased funding, critical capabilities would be cut, including the ‘highest priority’ of CT.

This week’s announcement directs additional funding to enhance technical capabilities such as forensics and surveillance, tactical response elements and intelligence—including 300 additional positions. Targeting those areas makes sense as they’re critical to meeting current and emerging threats and crime types.

One of the strongest elements of the package is that it’s a four-year commitment. Sustained multiple-year funding is essential to developing, introducing and sustaining new technical capability. The 300 positions in the package also need a longer timeframe to allow the recruitment, training and building of new teams: so many qualified and experienced specialists can’t be found only from within the police and intelligence communities.

So where does that leave funding for the rest of the national security community?

Despite increased demands—CT agencies have been stretched as never before over the past two years—Commonwealth national security agencies weren’t exempt from the government’s efficiency dividend to recoup funds from existing budgets. While such measures bring fiscal accountability and management to the fore, they also ultimately detract from overall capability.

Recognising this, in February the Parliamentary Joint Committee on Intelligence and Security—the relevant oversight committee—recommended CT agencies be exempt from the efficiency dividend. The AFP funding announcement suggests that the government agrees—at least with the need to restore funding, if not how. While Minister Keenan confirmed there are no plans to withdraw the efficiency dividend requirement, it’s clear that additional funding is now forthcoming in accordance with long-term agency plans. The Prime Minister noted with approval that the AFP funding was the first stage of the agency’s strategic 10-year plan.

We won’t necessarily hear as much detail about other CT funding, either in the budget or elsewhere.

Whether increases in ASIO staff or funding for Defence operations, decisions about security-related funding are normally the subject of Cabinet’s National Security Committee deliberations rather than federal budget headlines. It’s now clear the government understands the need to reverse the downward trend of funding and meet the needs of our national security agencies.

Some additional measures are likely part of the current Budget process, while others will emerge as government responds to a range of current inquiries. The independent review of the Australian Intelligence Community will likely identify areas requiring further attention. The review of Defence’s role in CT should shed light on the lack of effective and practised response coordination and capability more broadly across the Commonwealth which will require dedicated attention and sustained funding.

Having demonstrated their fiscal responsibility, national security agencies are now receiving sorely needed funding. The AFP announcement is just the most public. Sustained and long-term investment in critical policing and security intelligence capabilities is essential to maintain existing capabilities and build those needed to counter future threats.

No taxation without representation, with Chinese characteristics

Chinese Yuan

If you thought the Australian budget was a difficult beast to wrangle, you won’t envy the Chinese government’s predicament.

Deutsche Bank predicted earlier this year that Chinese central government revenue will grow by a mere 1% in 2015—the lowest rate since 1981. Local government revenue is also forecast to fall by 2%—the first contraction since 1994.

Figures released by China’s Ministry of Finance for January to May 2015 show income rising 5% across all levels of government compared to 2014. However, if revenue from government ‘funds’ is considered, which is largely based on revenue from land sales, then total income fell nearly 6% compared to the same period in 2014.

Chinese Premier Li Keqiang’s announcement in March of a 2.3% fiscal deficit target for 2015—a target increased in early May to 2.7%—might not sound particularly worrying, but this number hides a worsening situation. The Chinese central government raises just under half of the country’s government revenue, but the provinces spend 85% of it.

Not a single province reported a budget surplus in 2014 despite Chinese law until recently ostensibly forbidding local governments from borrowing money. Local governments use creative financial arrangements to hide revenue shortfalls, making it difficult to determine the extent of their debts. However, Wei Yao from Societe Generale estimated earlier this year that local government could have debts of nearly US$5 trillion. This would put China’s local government debts at nearly 50% of GDP.

This is all in the context of the Chinese government having increasing demands on expenditure going forward. The population is ageing, health and social welfare costs are rising, and modernising the Chinese military and funding China’s foreign policy is not cheap. More fiscal stimulus to counter falling growth rates appears to be in the offing.

One way to counter this bleak picture would be to raise revenue brought in by income taxes.

Individual income tax makes up only 5% of government revenue according to the National Bureau of Statistics of China in their 2014 China Statistical Yearbook. That 5% compares to an average among OECD countries of 25% in 2012, rising as high as nearly 40% for both the US and Australia.

The Chinese government does indirectly tax citizens by artificially keeping interest rates low and savings rates high. This effectively uses the Chinese people’s savings to subsidise state-owned banks and help fund state-owned enterprises and local governments. However, this policy, known as ‘financial repression’, is being reversed as the Chinese government tries to encourage consumer spending and reform the financial sector.

In the meantime, China has a lot of room to increase income tax revenue, with the China Daily reporting in March this year that only 2% of the Chinese population even pays income tax.

Increasing income tax isn’t easy, though. It was the Qing Dynasty in 1911 that first attempted to introduce personal income tax in China. The dynasty collapsed later that year.

Indeed, history provides numerous examples of citizens demanding reform from high-taxing governments. From English barons in the 13th century and the bourgeoisie that brought revolution to France, to the citizens of the Thirteen Colonies in America, taxpayers demand accountable government.

If Chinese government expenditure continues to rise and revenue continues to stall, raising income taxes looks increasingly necessary. However, the slogan ‘no taxation without representation’—which originated just before the outbreak of the American Revolution—has had particular historical resonance.

Representation, however, doesn’t just mean Western democracy, or that we’ll see Communist Party members part with their heads like Marie Antoinette. That said, historical precedence suggests that if China wants to make its citizens pay more for their government, its citizens will want more say in governance.

Prime Minister Tony Abbott’s praise of Chinese President Xi Jinping last November for his commitment to transforming China into a ‘democracy’ brought an awkward end to President Xi’s Australian visit. The Chinese Communist Party, it turns out, has a different understanding of the word ‘democracy’ than Australian ideas of liberal democratic governance.

Despite this, President Xi’s statement before the Australian parliament that China aims to become ‘democratic’ is telling of his appreciation of the need for more representative governance. However, when President Xi speaks of a ‘democratic’ Chinese state he isn’t speaking to the West, but to the Chinese citizens he knows will have to pay for it.

Cyber Wrap

AOL co-founder Steve Case

The third wave of the Internet is upon us, or so suggested AOL co-founder Steve Case at this year’s SXSW Interactive in Austin this week. According to Case, companies will need to foster partnerships with embedded stakeholders such as teachers, doctors, and large corporations in order to thrive. Case continued that tech businesses would need to improve and increase their interaction with government as its role as both regulator and customer is ‘heating up.’

A glance at US Department of Defense budget figures leaves no doubt that the government focus on cyber is already intense. Spending at US Cyber Command is set to skyrocket by 92%, with costs totalling out at just over $1 billion over the next five years, with department-wide cyber spending estimated to hit $5.5 billion for fiscal year 2016. If numbers aren’t enough to convince readers of the high priority the Pentagon’s placing on cyber, US Secretary of Defense Ashton Carter’s decision to make Fort Meade his first troop visit underlined the case. Read more

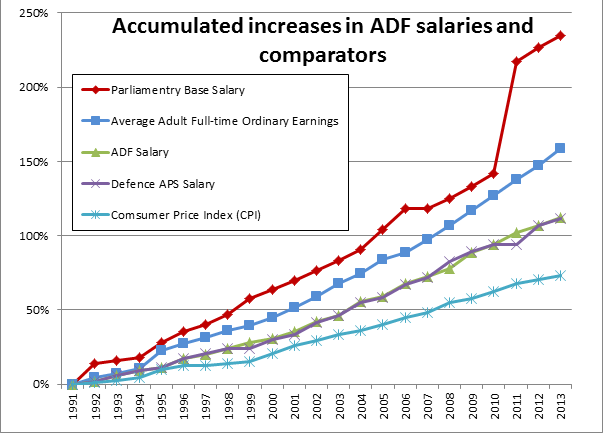
Graph of the week: ADF pay

Graph - salary increase comparatorsThe government’s offer of a 1.5% p.a. pay rise for each of the next three years in exchange for a reduction in leave entitlements and other allowances has been met with dismay. This is one of those issues where the facts speak for themselves. So here are some facts:

According to the government’s own figures, inflation is projected to be 2.25% in 2014-15 and 2.5% for the three years after. With a little arithmetic, this means that the government’s offer of 1.5% per annum would result in a cumulative reduction of 2.66% in real terms over the next 36 months. Compared with the remainder of the labour force, the picture is worse still. The government projects that the Wage Price Index will run at 3% over the next two years.

Two things are noteworthy in this regard. First, the Defence budget is indexed at 2.5% per annum to take account of inflation. Second, the ADF workforce has been quarantined from efficiency dividends under the current and previous governments. It follows that an inflation-matching salary increase of 2.5% per annum could be afforded from within existing funding without redirection from other programs (consistent with the government’s 2014 Public Sector Workplace Bargaining Policy). Read more